CVE and Context
Recently, I was listening to Security Now (ep: 541) when Steve Gibson warned his listeners of articles claiming Apple is less secure due to the number of CVE's posted. Posts like Softpedia's article titledd "Surprise! Flash Is Not 2015's Most Vulnerable Software".
Suprise, they're wrong! Adobe is the most insecure software of 2015!
Disclaimer
At the bottom of this blog you can find the source that analyzed the data and generated the graphs. You can download the data and learn more about their scoring system here.
Intro
Softpedia's post seems to indicate that software written by app was less secure than software written by Adobe in 2015 based on the number of bugs reported. At first glance, they are not wrong. Apple had 564 CVE's and Adobe had 473. But let's break it down because we are engineers and not reporters.
First and foremost, CVE's are optional and the following data does not take into account all of the security bugs that were discovered internally or from a side channel and never made it into the national database. Google's Project Zero project probably fixes many of their bugs internally which means they never make it to the database.
Secondly, the number of bugs reported does not necessarily mean that all of the bugs were found. It's just the portion of the bugs that were reported publicly and fixed publicly.
Assumptions
-
Vulnerability scoring
- [0 - 3] = Low
- [4 - 6] = Medium
- [7 - 10] = High
- All Linux based vulnerabilities grouped together
Based on the 2015 data captured from nvd.nist.gov
Top 5 Vendors with Reported Bugs
- ('apple', 564)
- ('microsoft', 527)
- ('adobe', 473)
- ('cisco', 467)
- ('oracle', 400)
Based on the numbers above, you can see how the post from Softpedia got it's start. Apple for sure has the most vulnerabilities.
Reported Bugs top 5 by score
Now, let's adjust it by how bad those vulnerabilities were based on the assumptions noted above.
- ('adobe', 9.179915433403846)
- ('microsoft', 7.543833017077846)
- ('apple', 6.1482269503546245)
- ('cisco', 5.896788008565312)
- ('oracle', 5.14125)
Note: 10 = bad, 0 = less bad Adobe has the worst average score.
Pie charts
Adobe
Adobe had the highest number of critical vulnerabilities in 2015 at 87%. However, it is important to put these vulnerabilities in context.
First, let's consider Adobe's web products such as Flash. These high vulnerabilities could give an attacker a foothold to a victim's computer via vulnerabilities present in Flash that then translates into vulnerabilities in web browsers. The attack in nature could be remotely controlled. This is why these attacks are categorized as critically high.
Alternatively, Adobe's office products like their PDF viewer would give an attacker an attack vector through attached mail or even PDF's downloaded from the web by the victim. An attacker could run arbitrary code through vulnerabilities present in a PDF viewer.
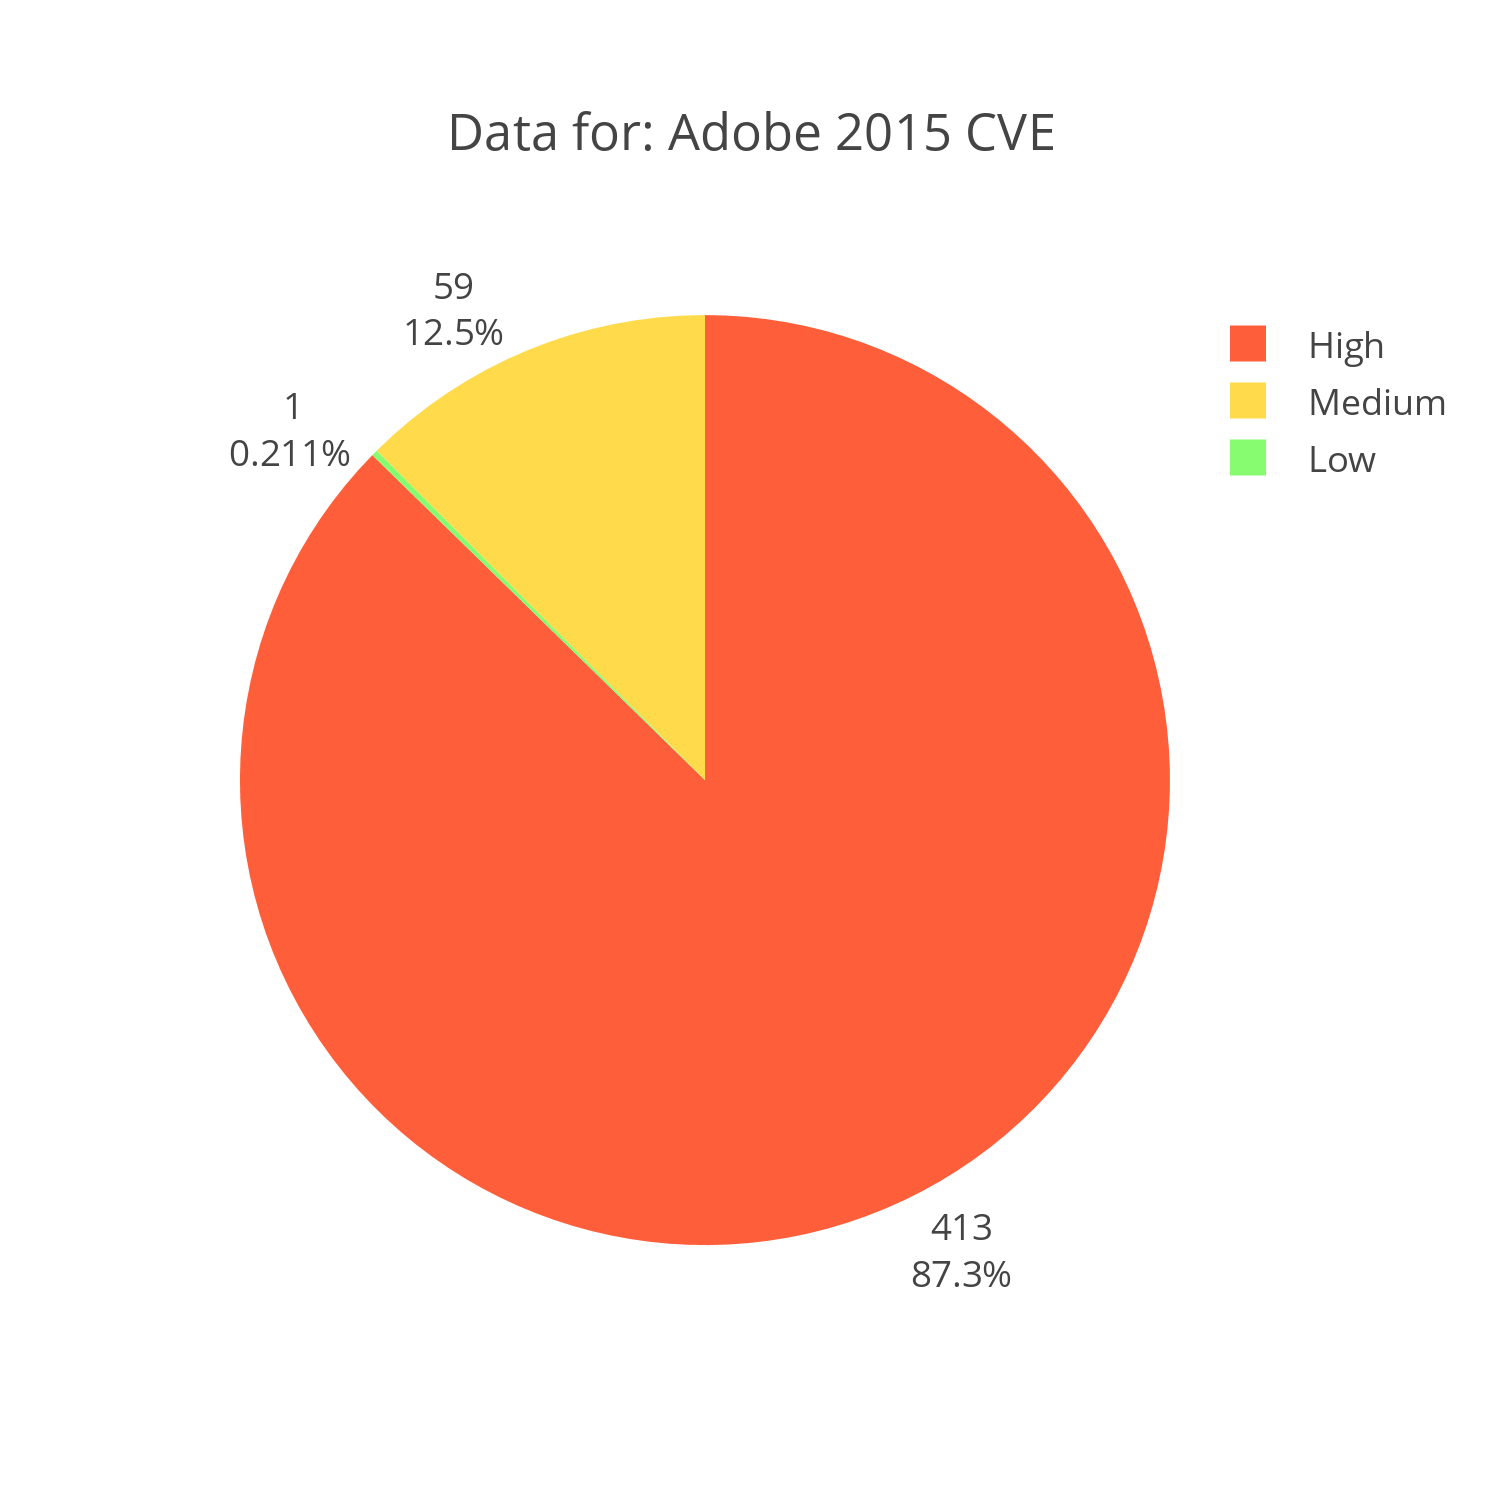
Interactive Chart Plotly Chart: Adobe CVE reports for 2015 distributed by severity
Microsoft
Microsoft's products are a bit harder to put into context. After all, they develop everything from an operating system to a word editor. However, high scoring CVE's typically are vulnerabilities that provide the attacker with remote access or privilege escalation given a local user. Attacks like CVE-2014-4114 that "allow remote attackers to execute arbitrary code via a crafted OLE object in an Office document" are extremely critical as they neglect to require system authentication and authorization to complete their tasks. Almost 70% of reported bugs in 2015 were like the aforementioned CVE.
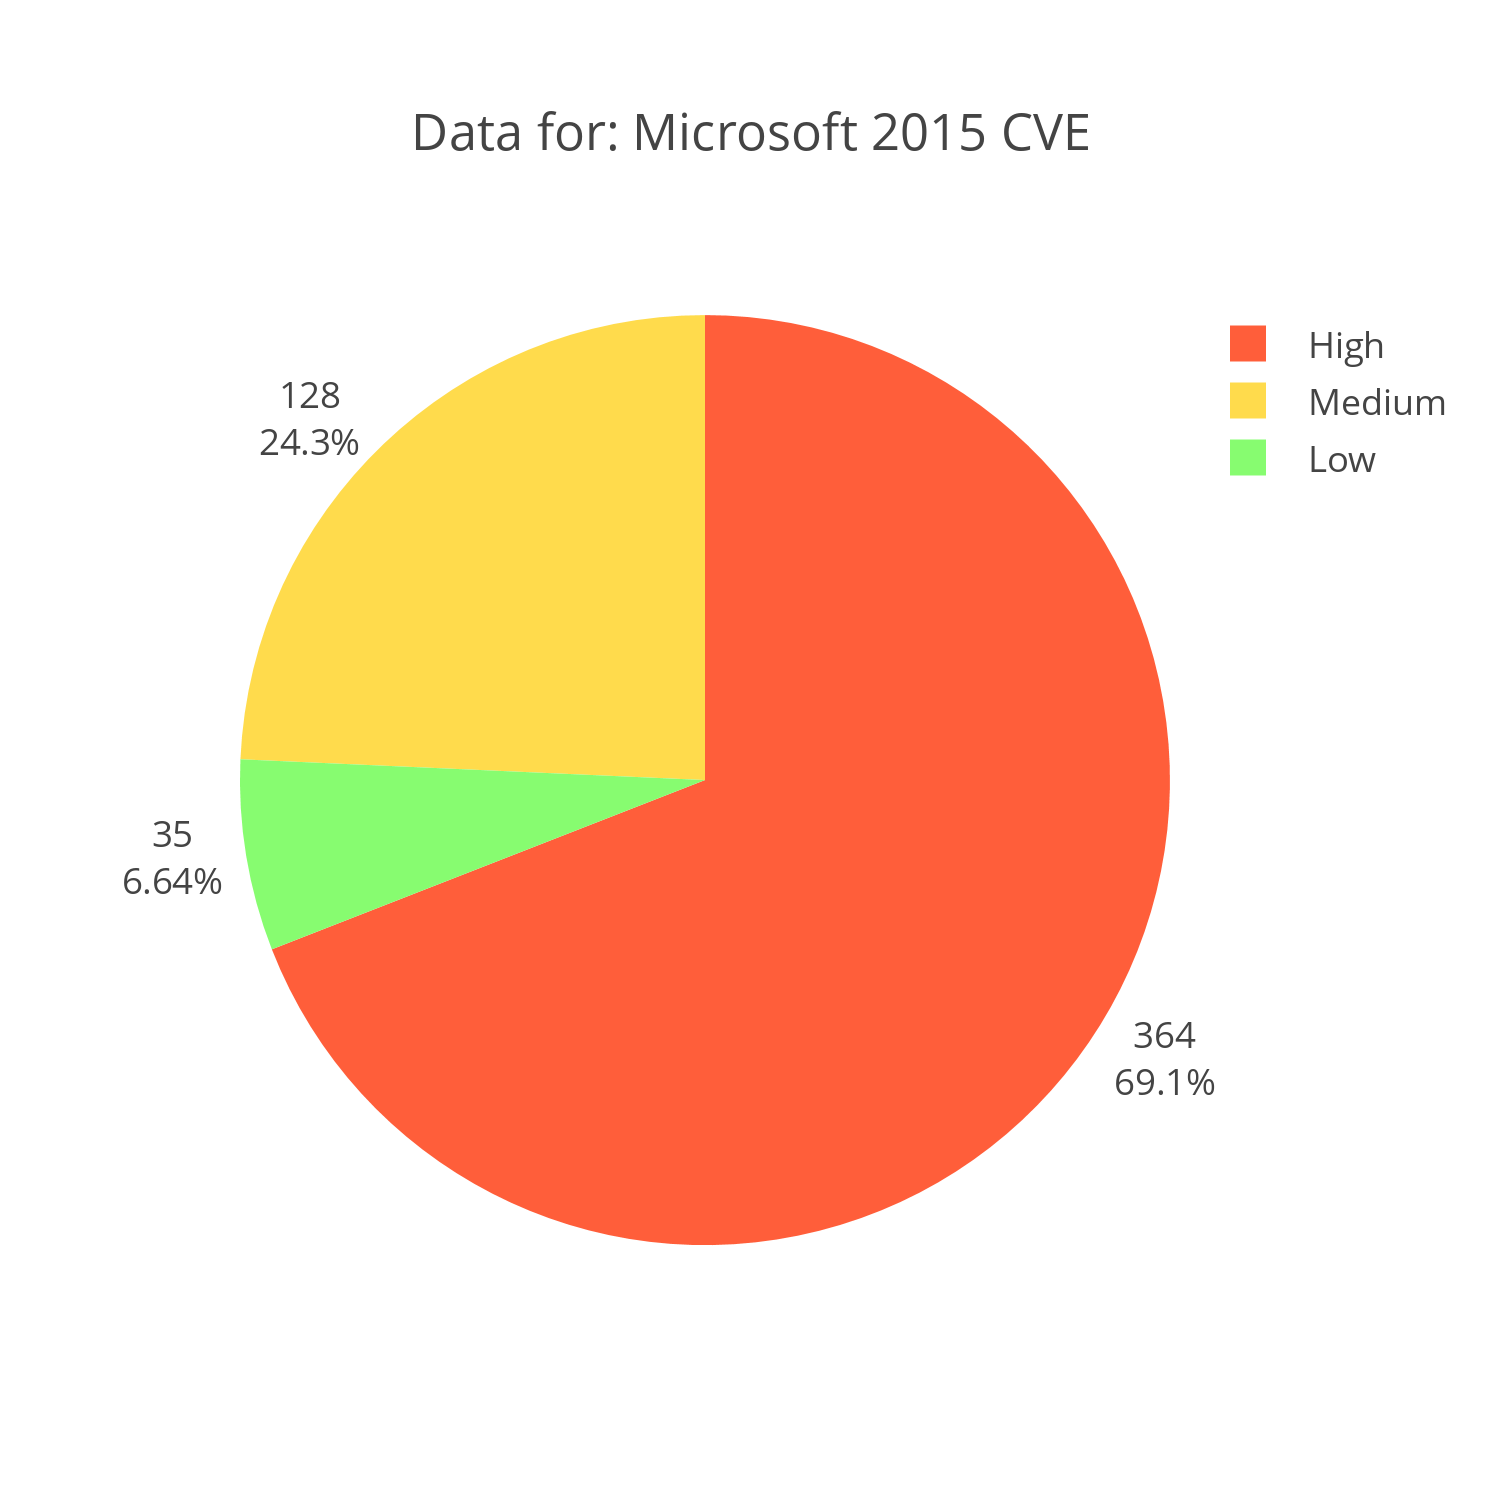
Interactive Chart Plotly Chart: Microsoft CVE reports for 2015 distributed by severity
Apple
Apple's products also range from an operating system to a word editor. However, it is important to note that the majority of Apple's reported CVE's are medium in scale. Attacks like CVE-2015-7012 that "allows remote attackers to execute arbitrary code or cause a denial of service (memory corruption and application crash) via a crafted web site, a different vulnerability than other WebKit CVEs listed" make up 67% of Apple's vulnerabilities. Only 26% of vulnerabilities have been rated high, which in my opinion would take away the most insecure software title from Apple.
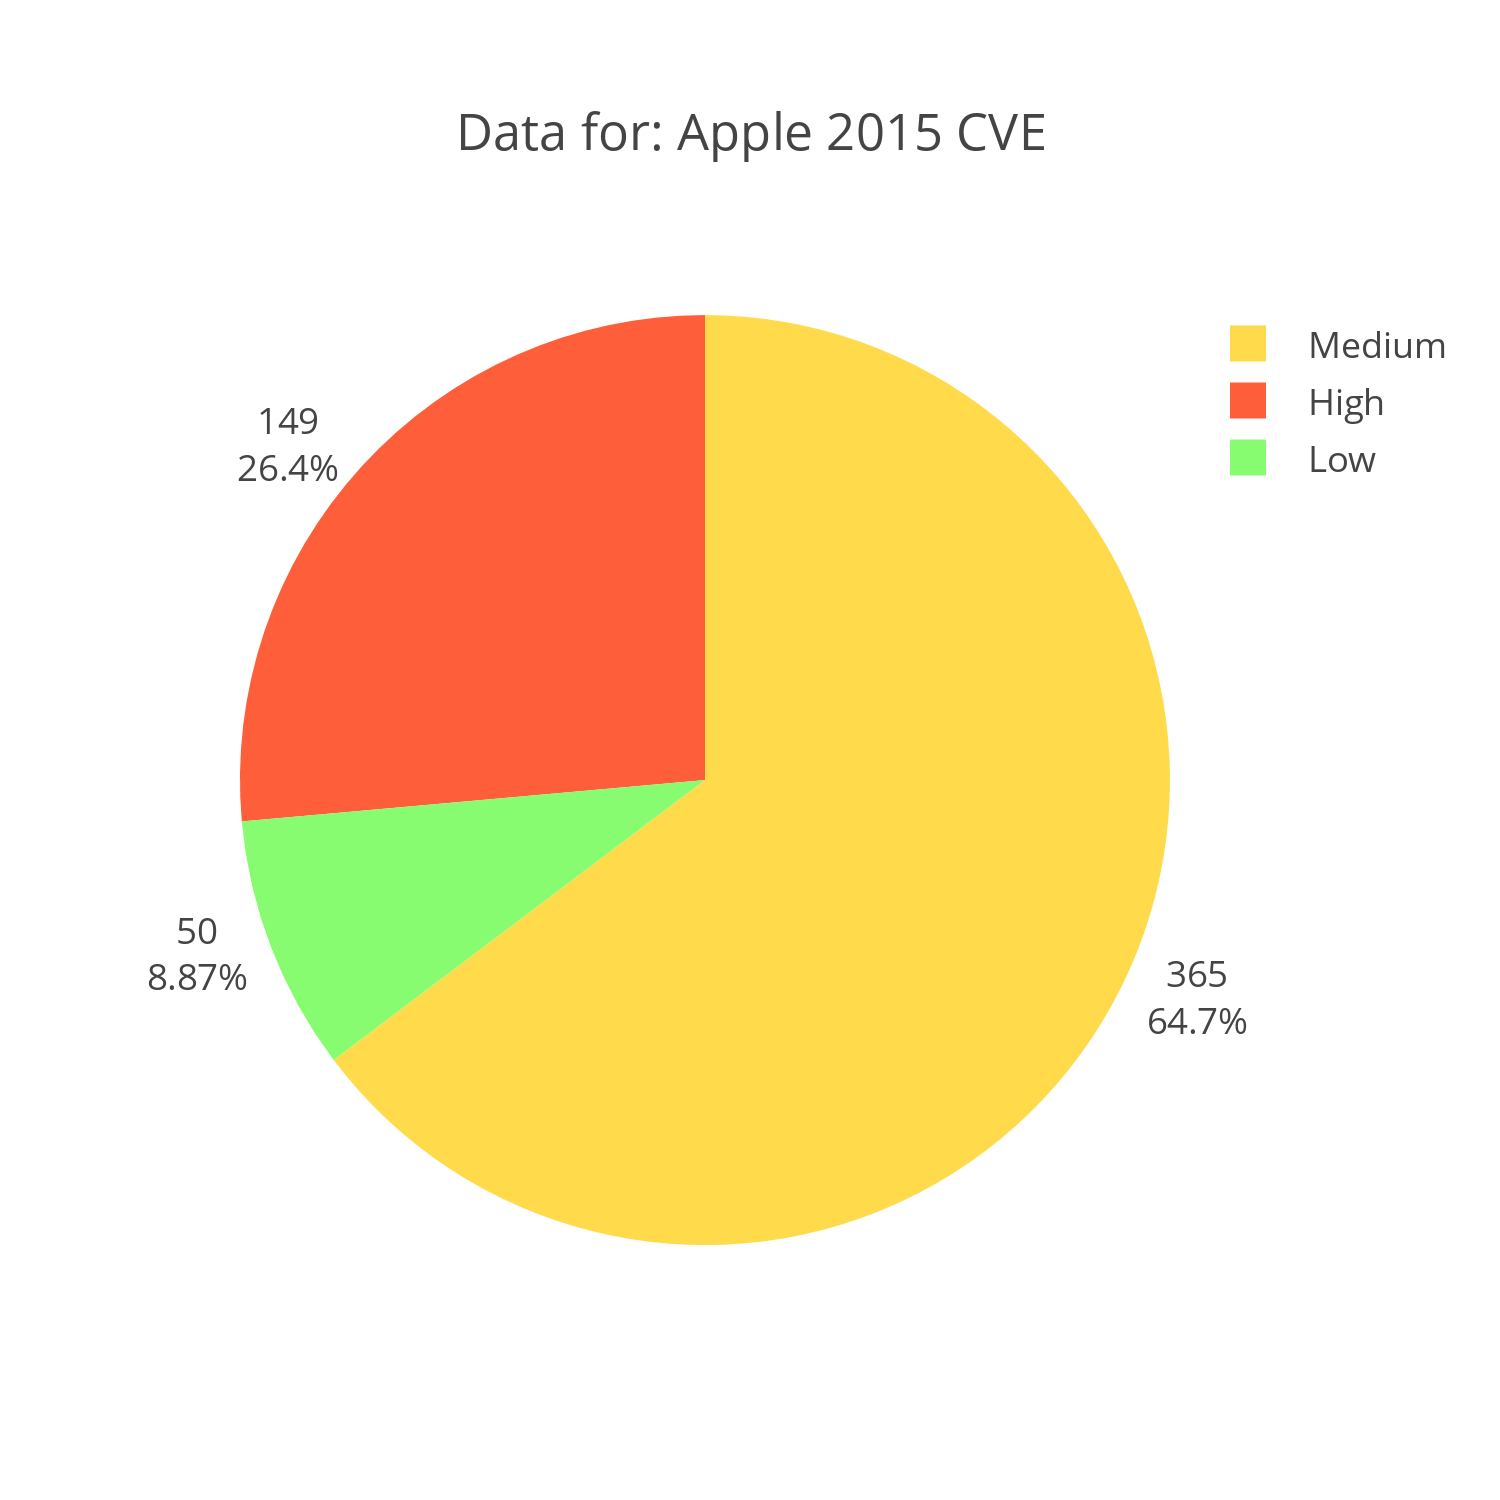
Interactive Chart Plotly Chart: Apple CVE reports for 2015 distributed by severity
Cisco
Cisco's vulnerabilities are a bit more interesting. For starters, even a simple denial of service (DOS) attack like the one mentioned for Apple poses greater risk when it comes to Cisco. Cisco provides much of the back bone of the internet and a simple DOS prevents the hardware from doing its job.
It is important to note that the code generating these graphs doesn't take into account consumer versus professional products, making my above statement a little suspect. The same DOS attack would mean very little if the equipment being attacked was just a consumer router; annoying, but less relevant.
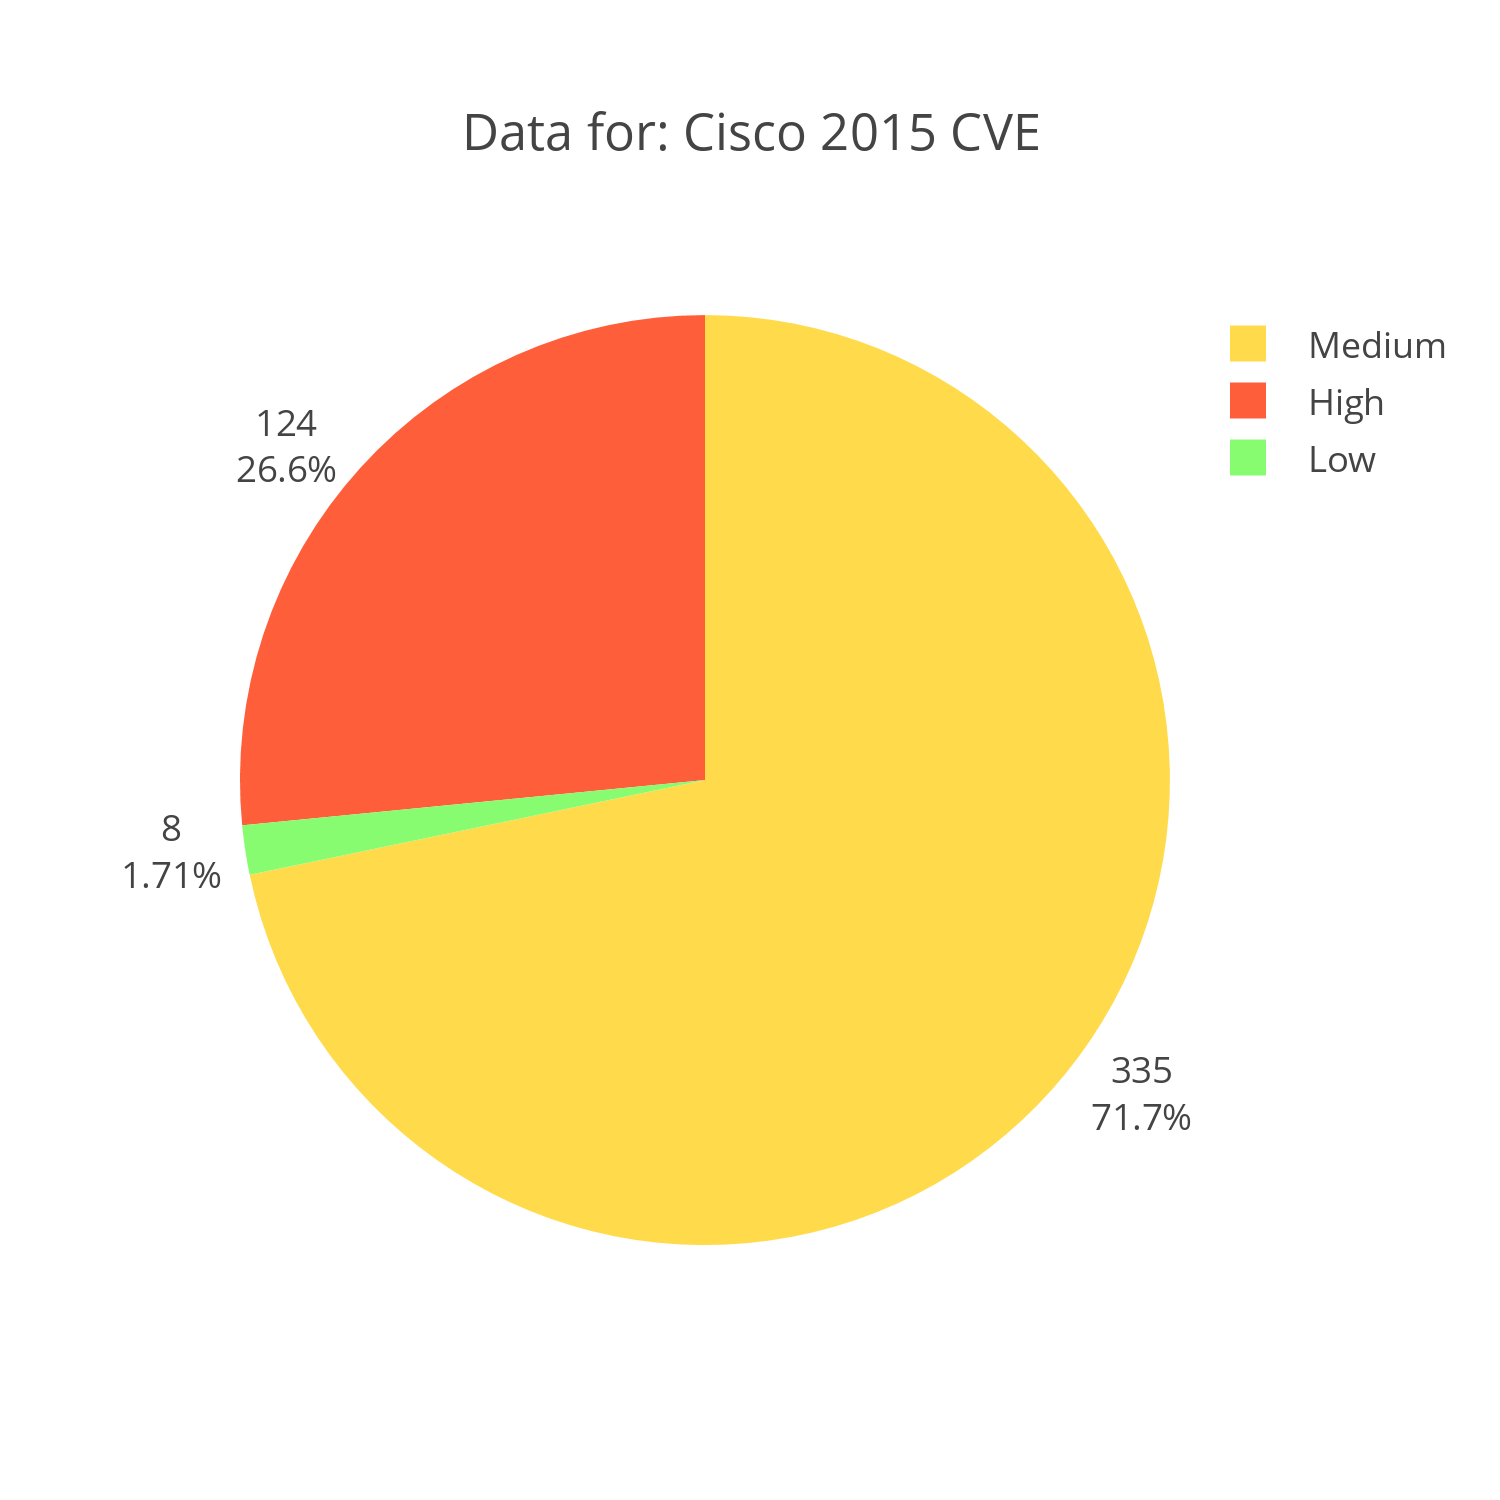
Interactive Chart Plotly Chart: Cisco CVE reports for 2015 distributed by severity
Oracle
It's important to note that some of the issues associated with Oracle in the early 2000's doesn't include Java which would have been reported under Sun Microsystems.
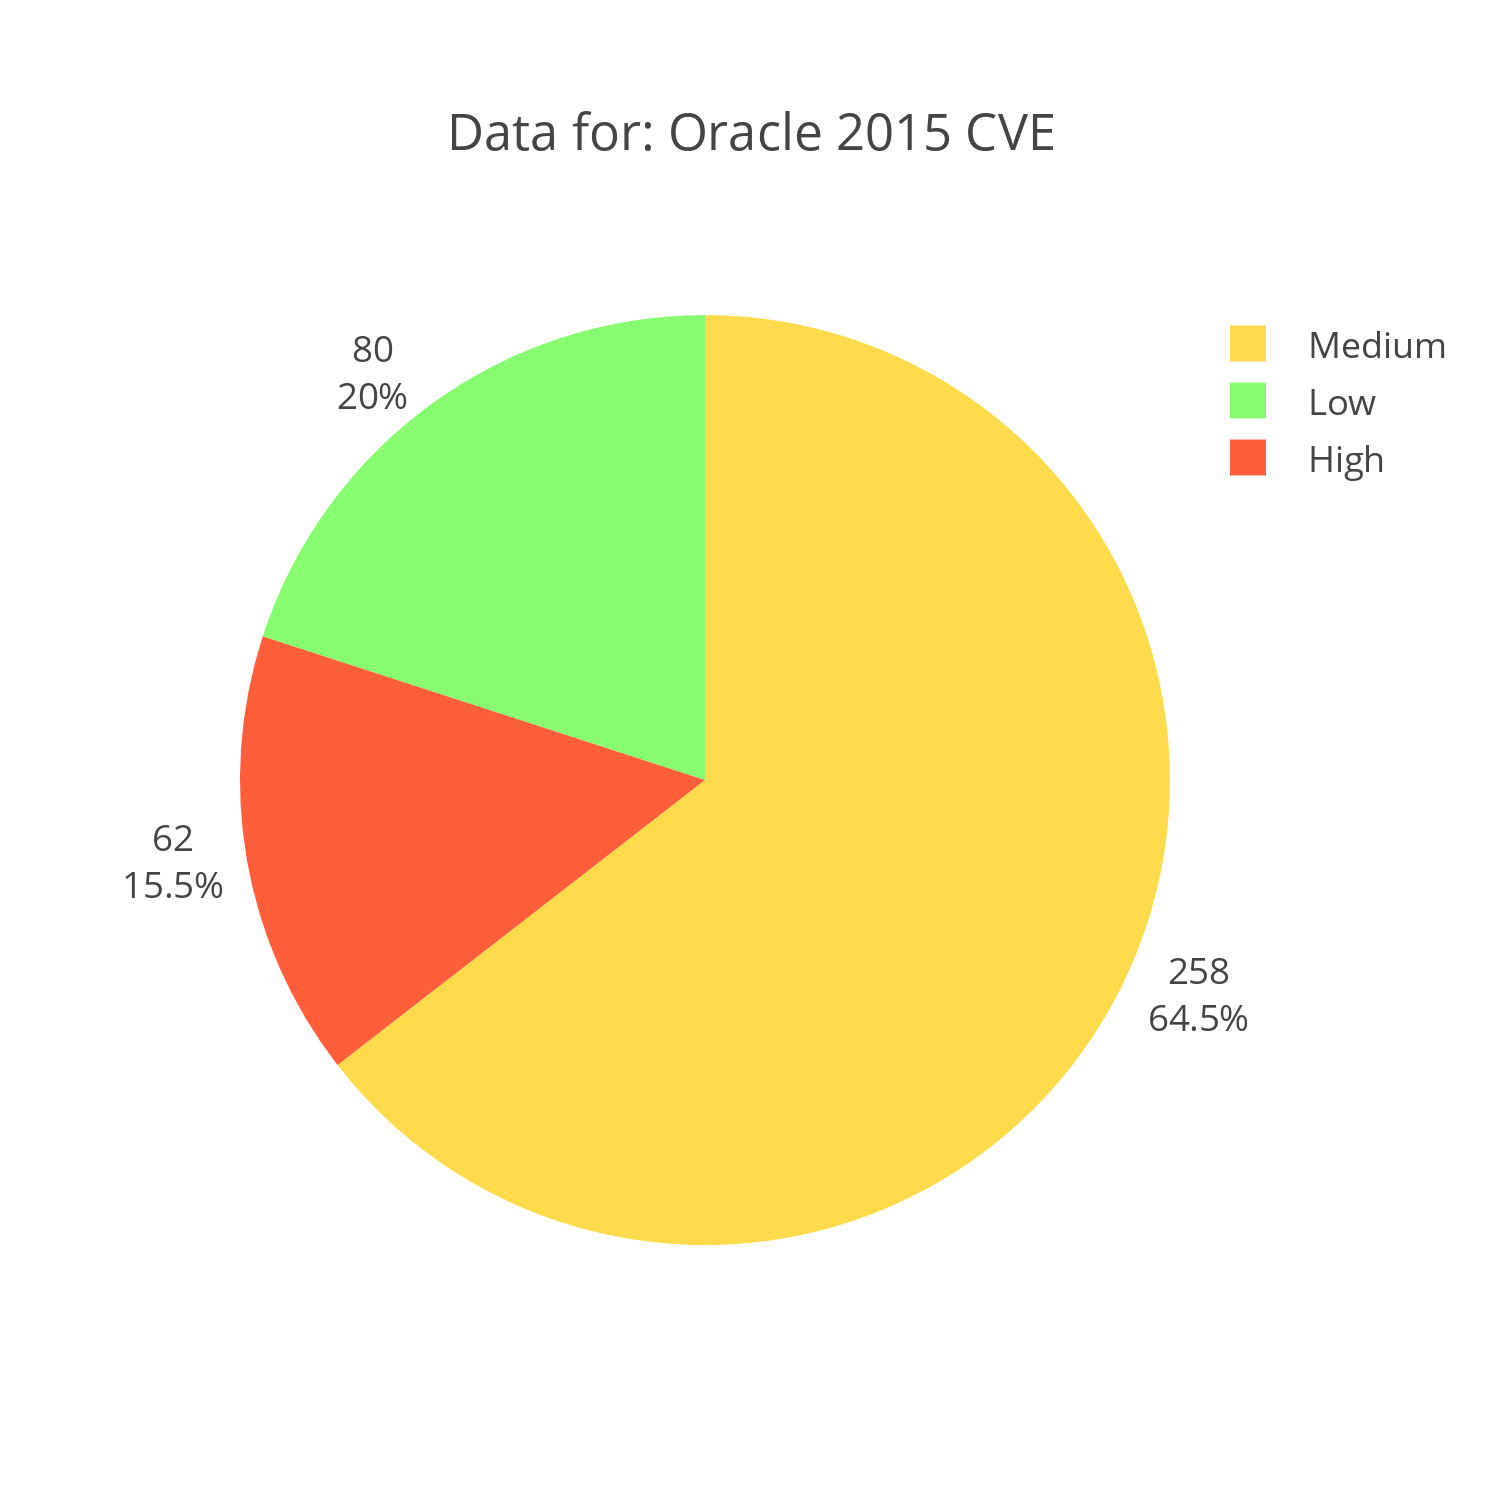
Interactive Chart Plotly Chart: Oracle CVE reports for 2015 distributed by severity
Summary
Not all vulnerabilities are alike and not all companies are alike. I believe that it all depends on the placement of a given product and the given vulnerability. While a layer 7 DOS attack on Apple products would be annoying, a layer 7 attack on Cisco products would be devastating simply do to its placement.
Line Charts
Since I already have this data downloaded, let's do a little more work. I have graphed the average score of these 5 companies (selected because they had the most CVE's in 2015) over the past 14 years and I gotta say, the curves are interesting.
Even though this graph seems to indicate that Microsoft and Adobe rate high in vulnerabilities, one should consider where these technologies are placed.
The wide usage of Adobe and Microsoft products in the industry gives hackers an incentive to look for vulnerabilities.
For each vulnerability found in Flash, they can target tens of thousands of of users. Flash is an especially attractive target for two reasons. For one, it's connected via the web which allows for remote attacks. Secondly, most implementations of Flash are often neglected and not addressed by the automatic update of the host operating system. Adobe's office products, like Adobe Reader, also provide an attractive attack vector as they are the de facto tool for viewing PDF's.
Microsoft across their multiple operating systems still holds the majority market share, which would also give the black hat community an extra incentive to target these products.
From doing all of this research, the only thing that stood out to me was the relatively low level of vulnerabilities that have been found on Cisco products, especially considering that they are what make the internet the internet.
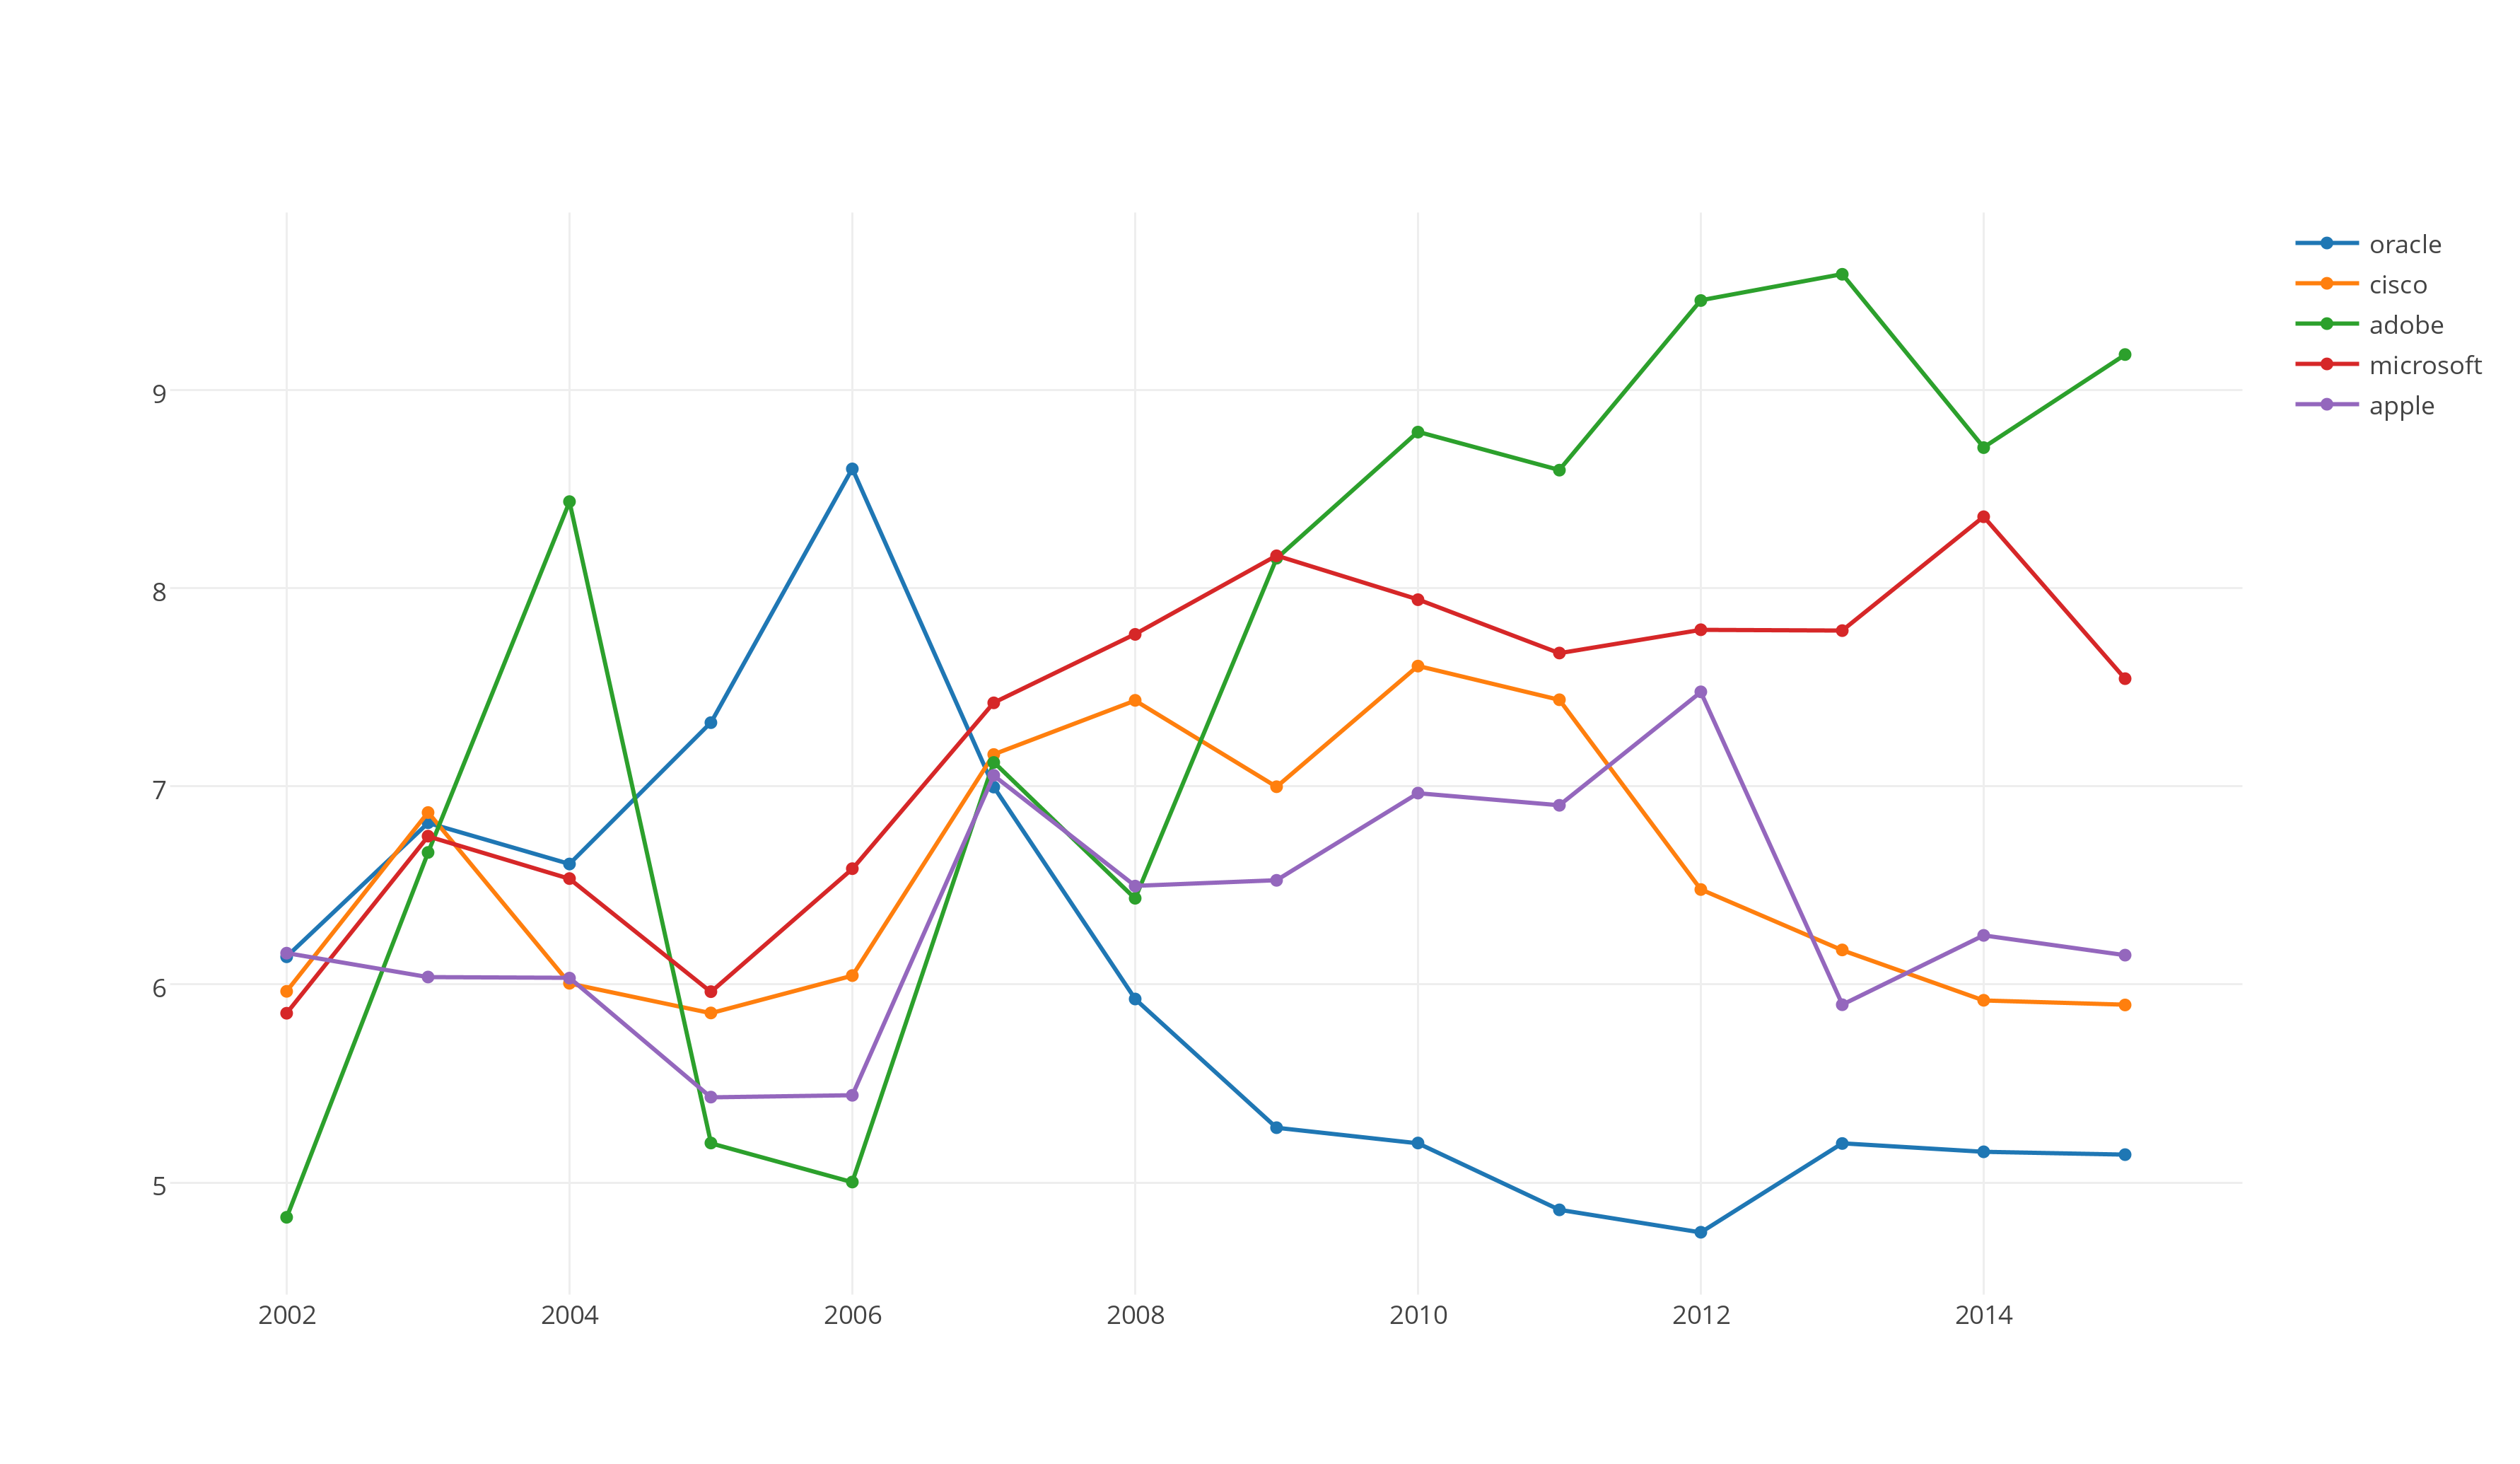
Interactive Chart Plotly Chart: CVE of Adobe, Microsoft, Apple, Cisco and Oracle from 2002 to 2015 based on average score
Source Code
I have attached my source code so that it can be viewed for issues with the charts. I used the Jupyter Python Notebook and Plotly to generate the graphs.
The code will function properly outside of Jupyter, however it will not generate the graphs.
December 10 2015